Do you need support?
Contact us

Regardless whether it is a first consultation or a concrete service request, with our contact form we put you in contact with the right person.
Introduction to FlexReportXL
Describes the capabilities of FlexReportXL.
FlexReportXL is skytron energy's second generation solution for creating sophisticated business reports from the PV plant data stored in PVGuard. It leverages the power of Microsoft Excel® to allow you to display and manipulate your plants' data using one of the most familiar tools available for a desktop user.
FlexReportXL defines a simple mechanism for defining which data from your plant is to be included in your reports, and its time-frame. You compose how your data will be presented, using all the standard worksheet, table, charting and other functions provided by Excel.
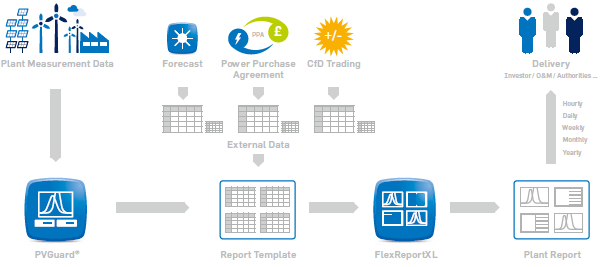
How it works
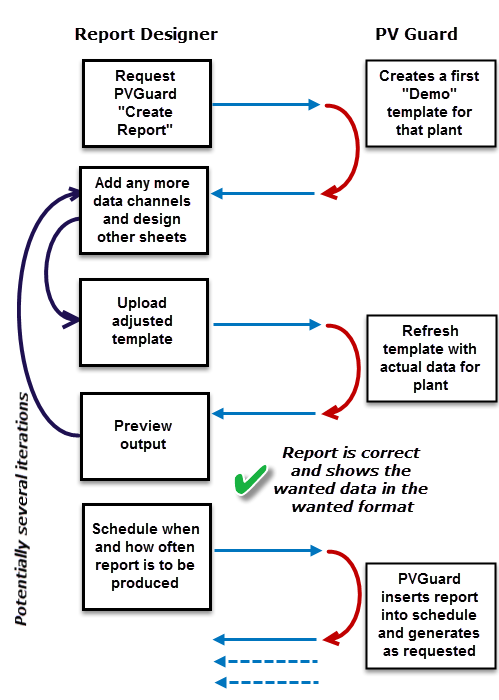
Initially, you need a FlexReportXL template. An initial version will be generated automatically by PVGuard for you for your plant. Once you have finished configuring this, you upload the template into PVGuard and have it fill in the actual data for your plant.
Next, you layout the rest of the report based on this real data. You can refresh the data as many times as you like - so your report design can evolve over a number of iterations. Once you are happy with the report's appearance, you upload the template specifying a delivery schedule for the reports.
PVGuard will then fill-in FlexReportXL template using the actual data from your plant or plant portfolio, according to the schedule and mail it automatically to the specified recipients.
Scope of the FlexReportXL Template Manual
This manual describes how to format a FlexReportXL Excel template that you can use with PVGuard. It describes how to configure the data channels whose data will be included in a report, and how to set the time-frame over which the data will be reported.
Full details about how to upload the template into PVGuard, and how to configure the schedule and recipients for the generated reports are given in the main PVGuard User Manual.
Principles of FlexReportXL: The Excel template
Describes how a user should complete the program.
The upper rows define the data channels whose data you want to use. These can be taken from any of the different devices in any of your plants.
The left-hand columns define the time-frame for the data. This may be specified in terms of absolute dates or times - for example "1st June, 2000", or as relative dates or times - for example "Today" or "This month".
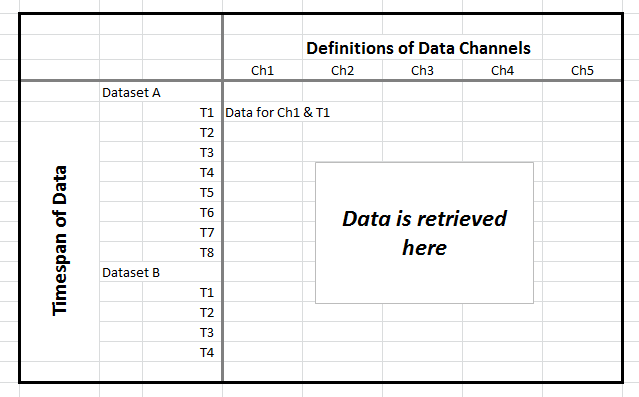
After you have defined the Data worksheet, you use the FlexReportXL function in PVGuard to upload this spreadsheet as a template. You must tell PVGuard when and how frequently you wish the report to be generated. Initially you may want PVGuard to fill the data in immediately, with real data to allow you to complete designing your actual report on the remaining sheets of the spreadsheet.
PVGuard will then run a service at the times you have specified. This loads the template you have uploaded and reads the definitions from the Data worksheet. It then fills in the cells at the intersections with the actual data for the data channel and time defined by the upper rows and left-hand columns. Finally it delivers the completed report to the recipeients you specify.
Each time PVGuard runs the report service, it will refresh the data with the current values (overwriting any data that was already there). However, it won't disturb any other sheets you have added to this spreadsheet, and the data you want will always appear in the same place of the data sheet. This means you can define as many other sheets as you want in the spreadsheet, which can all refer to the specific cells on the data sheet that contain the data they need. These other sheets can be formatted as you want, contain charts or images, with the data formatted as you need.
Steps in the Design Process
The steps in designing a report are illustrated in the below.
Using FlexReport in practice
In practice, FlexReport is somewhat more complex than the description above, owing to the complexity of data storage and retrieval for a large and sophisticated plant monitoring system like PVGuard.
The next sections look in more detail about how the template spreadsheet should be formatted, and the constraints that apply.
The Mandatory Sheets
Describes the three worksheets that FlexReportXL expects to find in your spreadsheet.
- Data
- PlantConfiguration
- ValuesList
By default, FlexReportXL will insert these as sheets 2, 3, 4 in the initial template. The first sheet is called Report. This sheet has been included to help you get going. You can change this sheet as you wish, rename it or even delete it.

An overview to these sheets is given below and they are described in detail in the next chapters.
Sheet: Data
The Data sheet is the most important working sheet in the FlexReportXL system. It contains the definitions of the data that is to be retrieved from PVGuard.
For more details about filling-in this sheet, see The Data Sheet.
Sheet: PlantConfiguration
Apart from the measured data for your plants from the Data sheet, you may also wish to include information about the plant configuration - either in the report itself or in calculations used for it. The PlantConfiguration sheet provides you with this information; it will be filled out with key data from the PVGuard plant configuration information. It includes data such as the plant's Alias (i.e. its usual name), Location (longitude and latitude) and the Currency in which the plant output tariff is calculated.
For more details about filling-in this sheet, see The Plant Configuration Sheet.
Sheet: ValuesList
The ValuesList sheet should be initially empty. It will be overwritten completely by the FlexReportXL process each time you generate a new report. It contains an auto-generated list of all devices and data channels (values) present in the plants referenced in the Plant(UPID) column of the previous PlantConfiguration sheet.
For more details, see Using the ValuesList sheet.
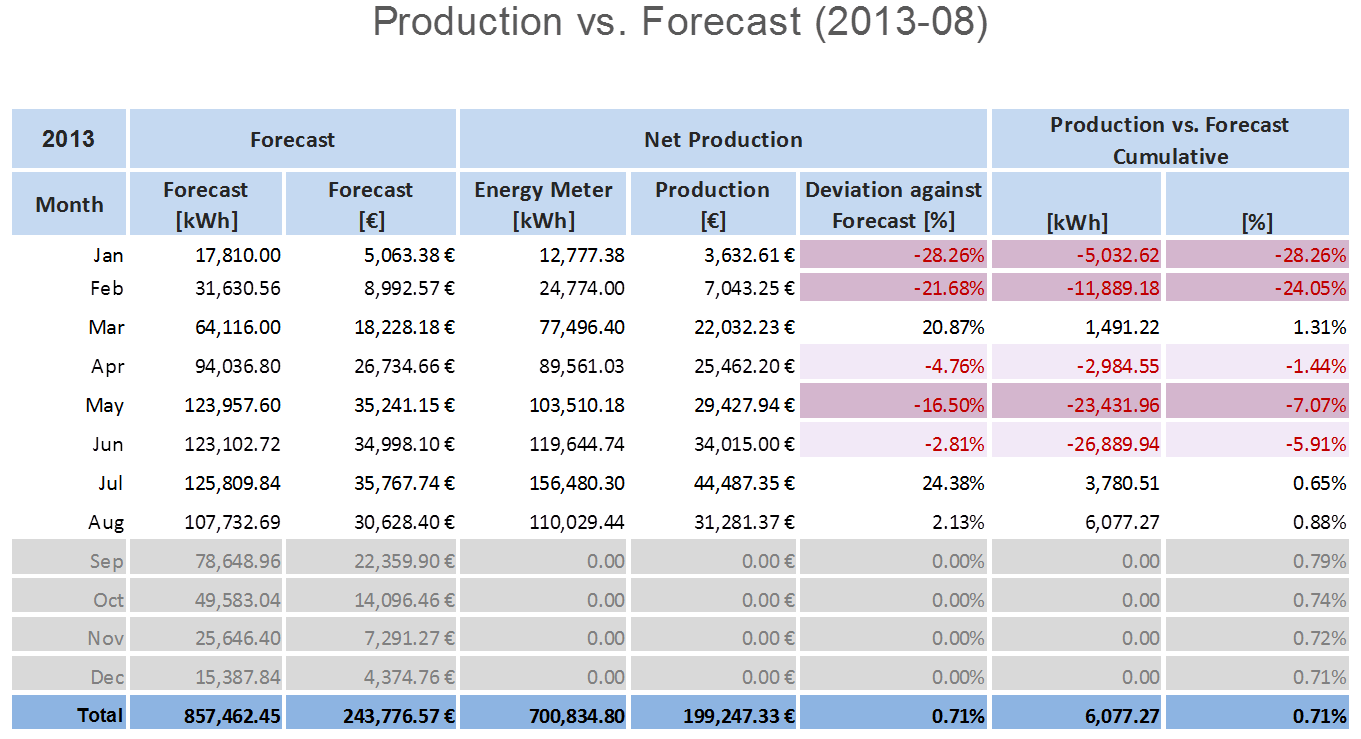
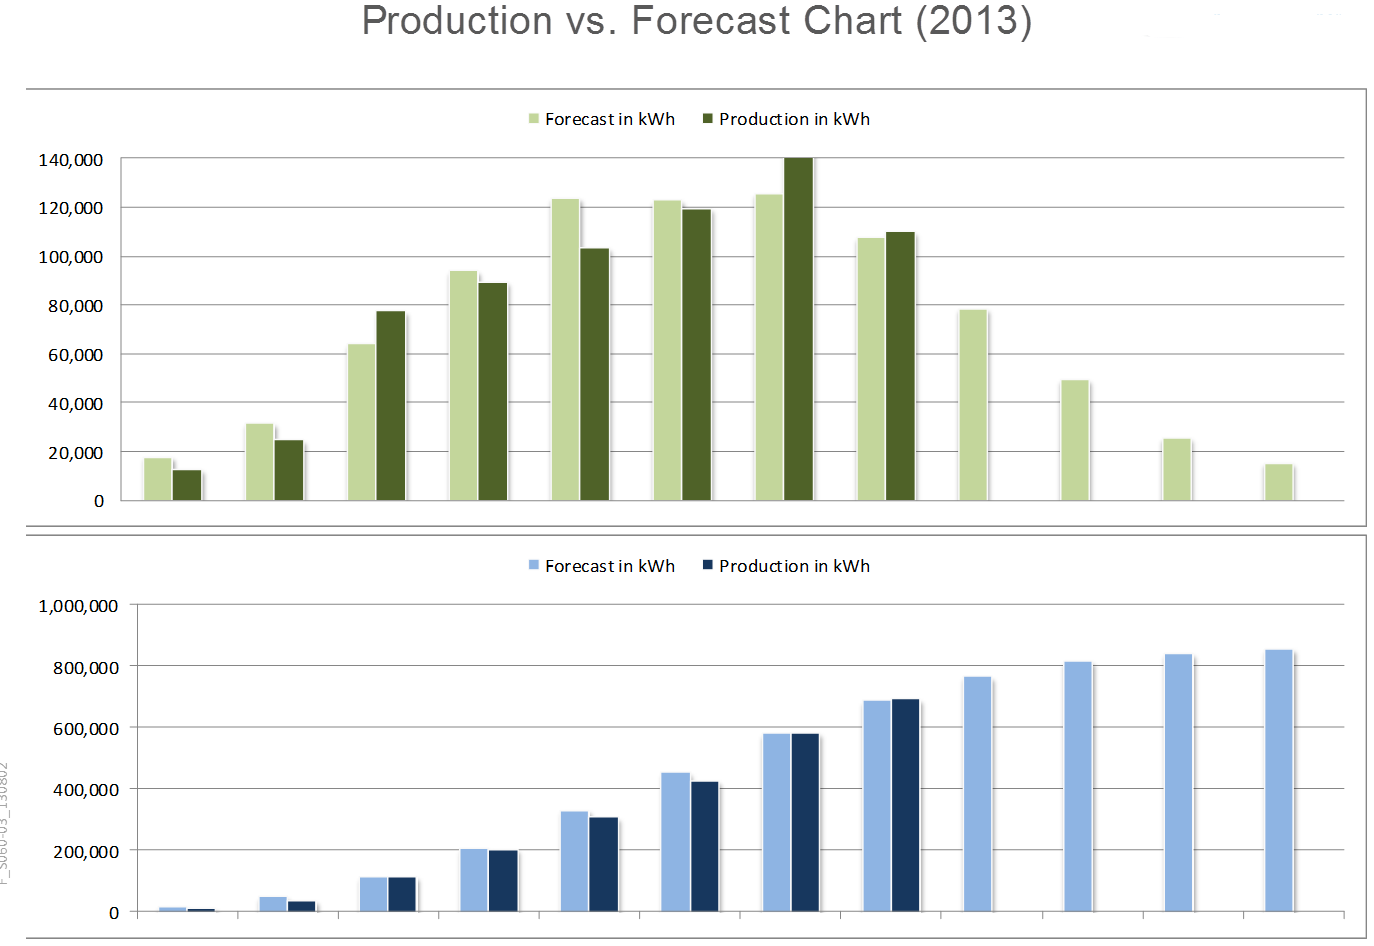
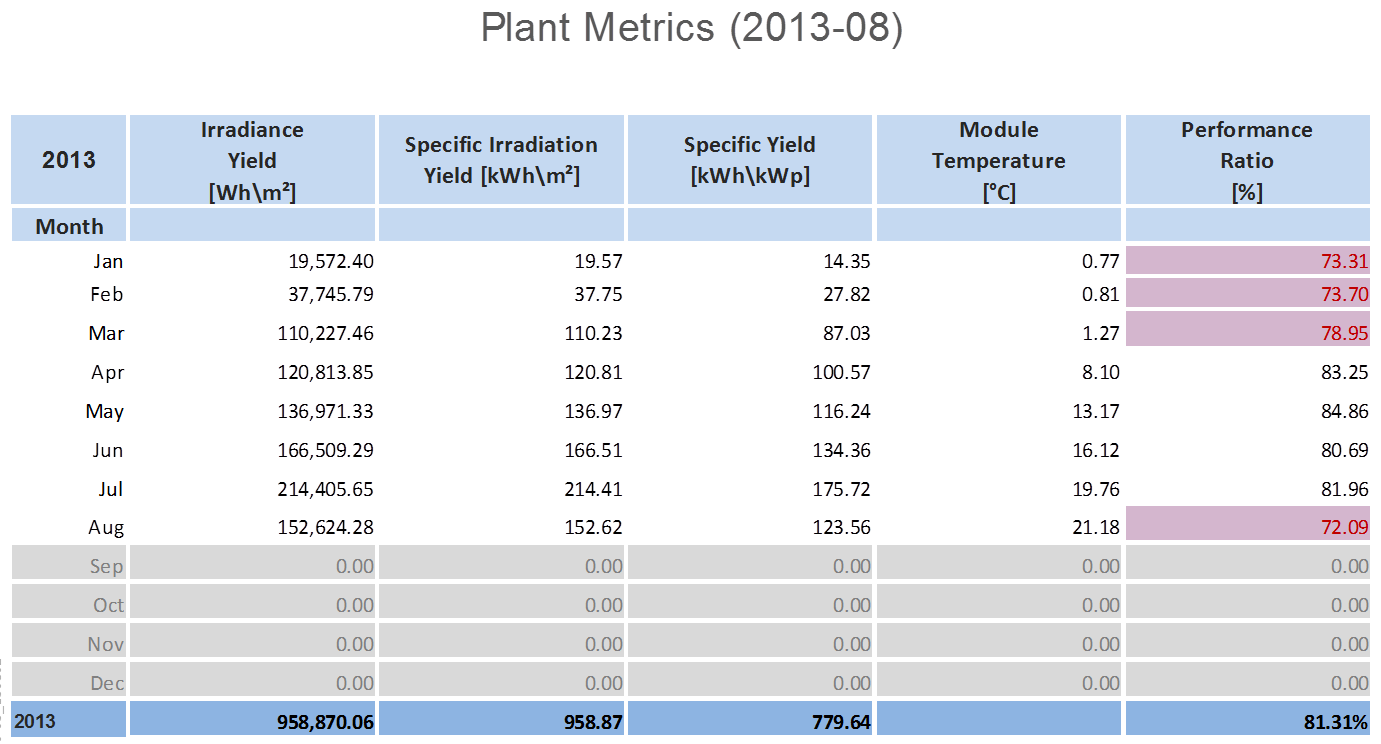
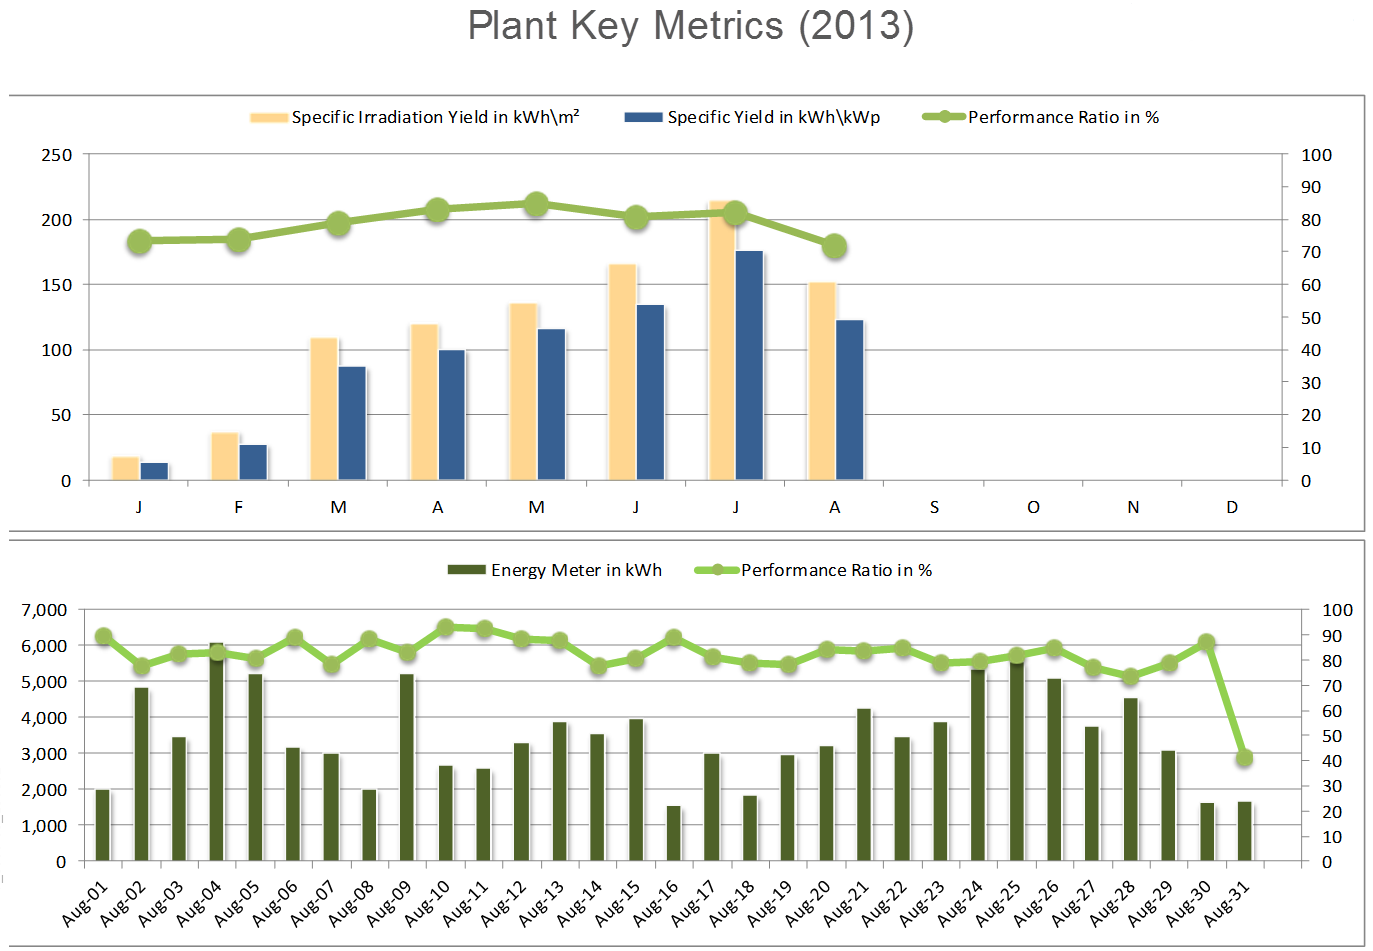
Illustrations of FlexReportXL Reports
Illustrates some sample report formats.
The format of the reports that can be produced by FlexReportXL is as open as the flexibility of Excel itself. The illustration below give some impressions:
The Data Sheet
Describes how to fill in the Data sheet in FlexReportXL.
The Data sheet initially looks similar to the example below.
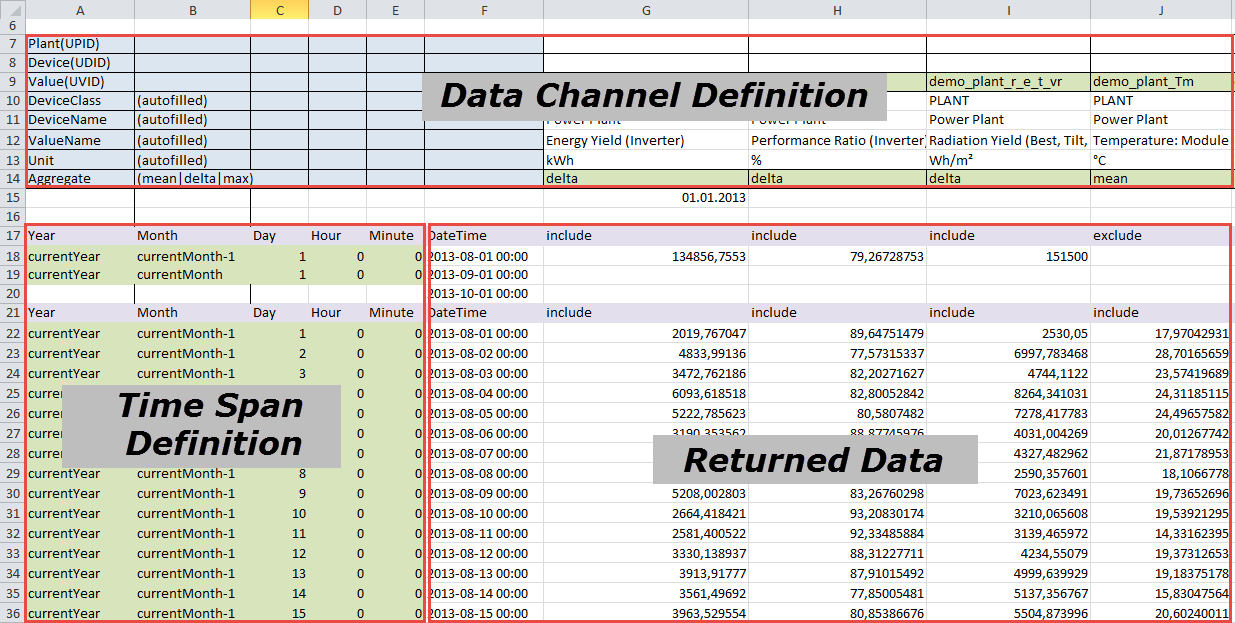
- The upper rows
- The columns here define the data channels whose data is to be included in the report.
- The left-hand columns
- These rows set the time period(s) for which the data is required.
- The returned data area
- This area will be updated by PVGuard each time that the report is produced.
- Green cells
- These are for your input.
- Gray/White cells
- These will be filled in by FlexReportXL.
Data sheet: User information
Describes how to fill in the Data sheet in FlexReportXL.
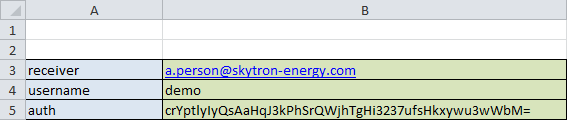
- Receiver
- The e-mail address to which the completed report must be sent. For example
- Username
- Your valid username for PVGuard (this will define which plants are available for the report).
- Auth
- An authorization string provided by skytron. If this string is not present and correct, the Excel template will be rejected by FlexreportXL. It will be issued to you by skytron and will be a long string of characters, for example: crYptlyIyQsAaHqJ3kPhSrQWjhTgHi3237ufsHkxywu3wWbM=.
Upper Rows: Defining the Data Channels
Describes how to fill in the Data sheet in FlexReportXL.
You define which data channels you want included in the report in the upper rows that form the headings above the data area. You should only fill in the green cells in the top and bottom rows; the other cells such as name and units will be filled out automatically when you receive the report.
- Value(UVID)
- The Universal Value Identifier that identifies this data channel in PVGuard. E.g. rag_plant_inv_pr.
- Aggregate
- The Aggregate defines how the reported data is aggregated (calculated) from PVGuard's raw data. It should be usually set to delta for energy data (Wh, kWh), and mean for all other data types. However, for special purposes any other valid PVGuard aggregate is possible, for example: min, max, sum. For more information see section Data Aggregate Functions.
Left-Hand Columns: Configuring the Time Span
Describes how to set the time-frame for the data reported in FlexReportXL.
Below the upper rows that define the data channels, the table is organized into Timespan Blocks. These are blocks of rows that define a distinct time period for which data should be retrieved. You can have any number of these blocks as you wish. For example, you might have one block that defines the data by days in the current month, and then another with the accumulated data for the months in the current year.
Each of these time block has a heading row at the top - shown with a gray background in the illustration.
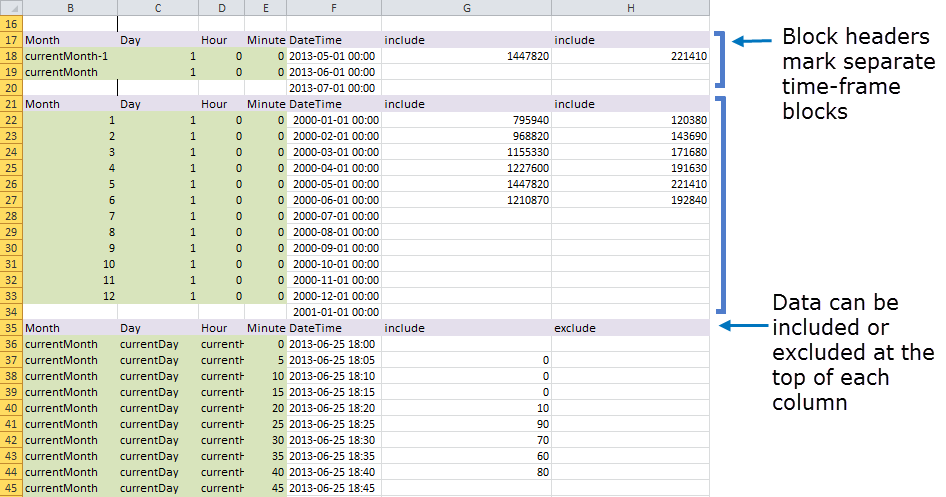
Under the heading come a series of rows that define the individual dates/times for the data. There are five green cells at the right in which you can enter the date/time definition for that row. To the right of these comes a single column which is filled in automatically, and shows the actual timestamp for the retrieved data. After this comes the data itself, filled in by PVGuard.
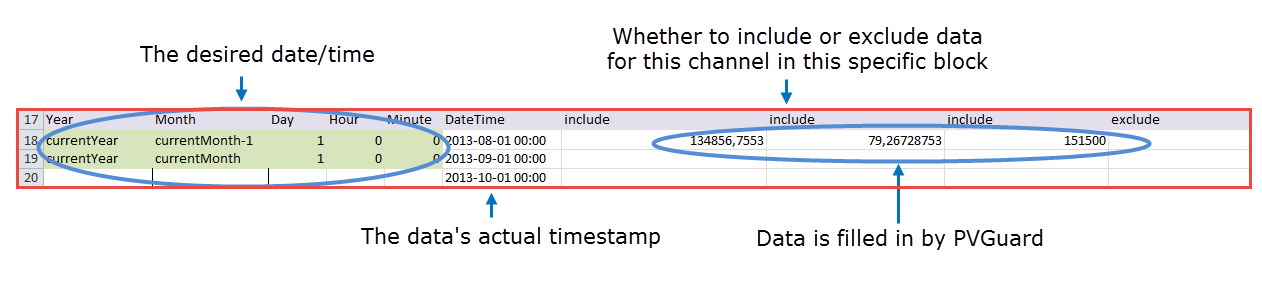
- Year
- An absolute value (e.g. 2010), or a relative date such as currentYear or currentYear-1
- Month
- An absolute (1-12) or a relative value such as currentMonth or currentMonth-1
- Day
- An absolute (1-31) or a relative value such as currentDay or currentDay-1
- Hour
- An absolute value, 0 to 23
- Minute
- An absolute value, 0-59
As indicated in the exmples above, relative time or date values may also be defined by giving an offset relative to one of the special terms currentYear, currentMonth, currentDay. For example, currentDay-1 or currentYear+1.
There may be any number of rows in each Time-Span Block. However the time or date interval between consecutive rows must be the same throughout the block. Note here that the difference between the first two rows of the block defines the time or date interval for the whole block. The remaining rows must also be defined with the same interval.
The Plant Configuration Sheet
Describes the contents of the PlantConfiguration sheet in FlexReportXL.
This sheet is filled in automatically each time the report is generated from the template. It consists of a series of rows, one per requested plant. The data in the columns show details about the configuration of the plant, as described below.
When you receive the first template, this sheet will be filled out with the information from the plant used to generate the template.

If you want configuration data from more of the plants, you can extend the report by filling in the next rows of the table with the UPIDs of any other of your plants.
The data shown might include plant details such as:
- Plant(UPID)
- The skytron unique reference identifier for this plant
- plant_alias
- The name by which the plant is usually referred
- altitude, latitude, longitude
- The plant's exact position
- plant_construction_type
- What sort of plant it is
- plant_ppeak
- The peak output capacity of the plant
- plant_tz
- Time zone of the plant. This may be useful when producing reports that cover plants across several time zones.
- plant_tariff_currency
- The currency to use for energy tariff calculations
- plant_commissioning_date
- When the plant was commissioned (ISO format)
- plant_tariff1_currency_kwh
- The energy tariff per kWh
- plant_reflectivity
- The reflectivity coefficient
- plant_module_xxx
- Various data concerning the plant modules
Using the ValuesList sheet
Describes the data listed in the ValuesList sheet in FlexReportXL.
The ValuesList sheet will be entirely overwritten by the FlexReportXL generation process each time you generate a new report. It contains an auto-generated list of all devices and data channels (Values) present in the plants referenced in the PlantConfiguration sheet (i.e. by the Plant(UPID) column).
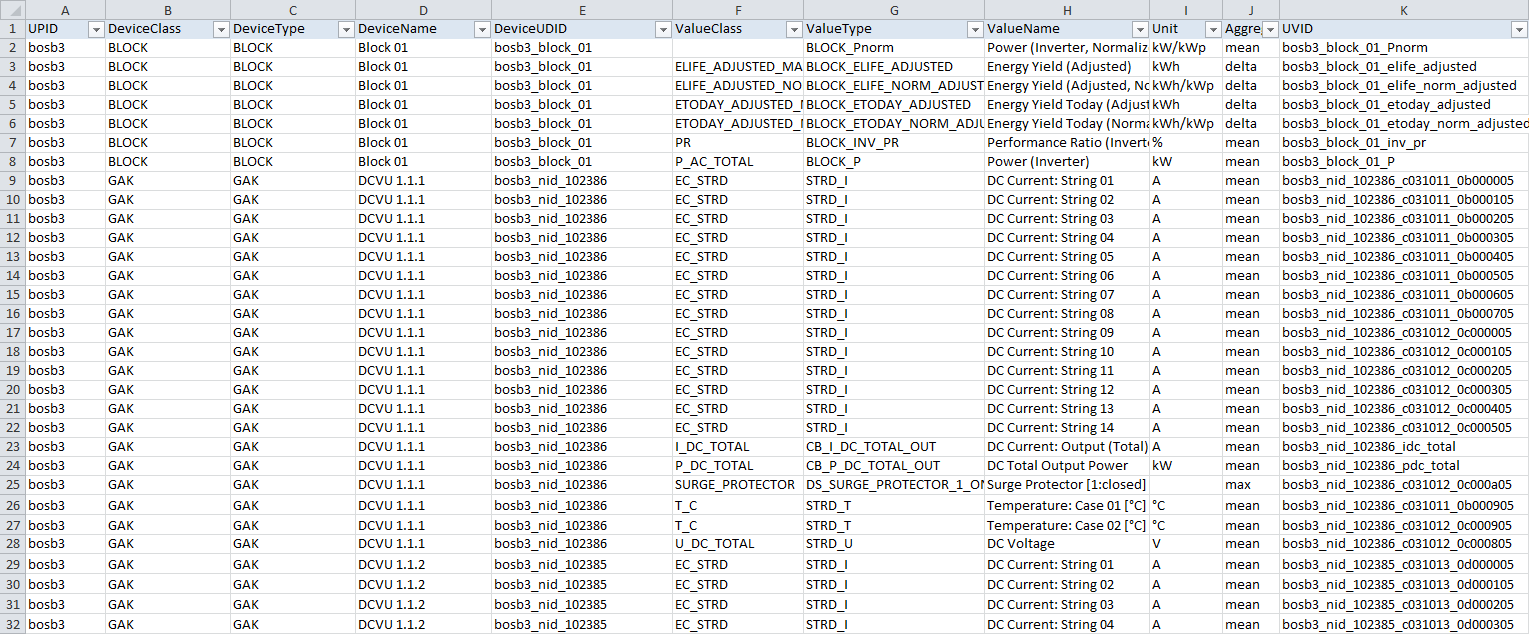
This sheet is intended to help you fill out the data channel definitions on the Data sheet. There, each data channel must be defined using its UVID. Since these UVIDs are not easy to remember or to type, they are listed in the ValuesList sheet to give you a source for reference.
You can copy the UVIDs directly from this sheet. Find the data channel you want by searching through the entries in columns A to J. Then the correct UVID will be shown in column K (UVID). Copy this value (e.g. use Ctrl-c) and paste it (e.g. using Ctrl-v) into the relevant column in the Value(UVID) row of the Data sheet.
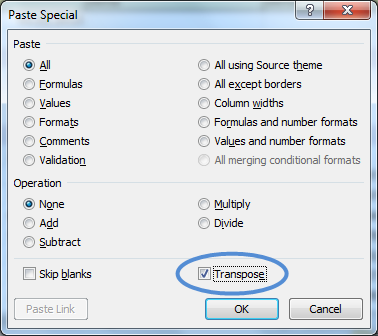
Copying a block of UVIDs
You can copy a whole block of values using Excel's Paste-Transpose function. This is explained below in Copying a range of UVIDs from the ValuesList to the Data sheet.
Copying a range of UVIDs from the ValuesList to the Data sheet
Describes how to use the paste-transpose function to paste UVIDs into the Data definition area.
If you want to copy a whole block of channels into the Data sheet, you can use using Excel's paste-transpose function as a short-cut.
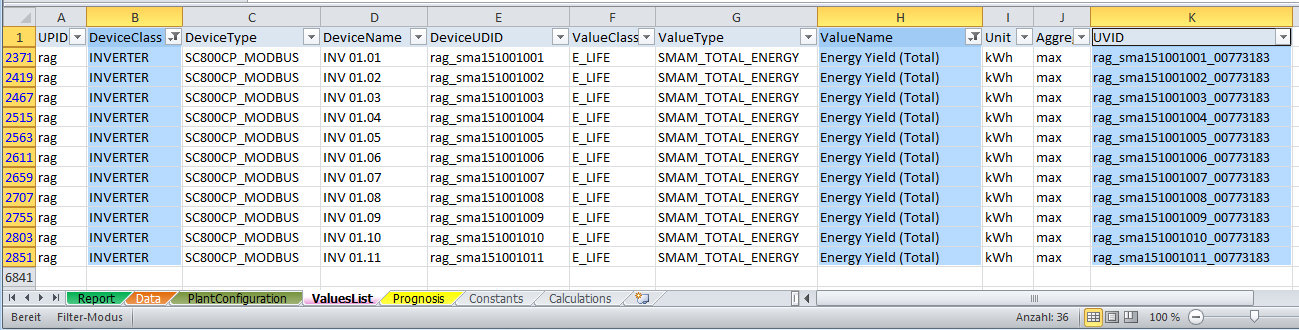
First, open the ValuesList sheet, showing all the data channels in your chosen plants. If the list is long, use the Excel Auto-Filter function to limit the amount of data shown.
Next select the UVIDs for the data channels you want in your report by using Excel's multiple select feature. Copy the data from just column K, UVID,for the range you want to the clipboard.
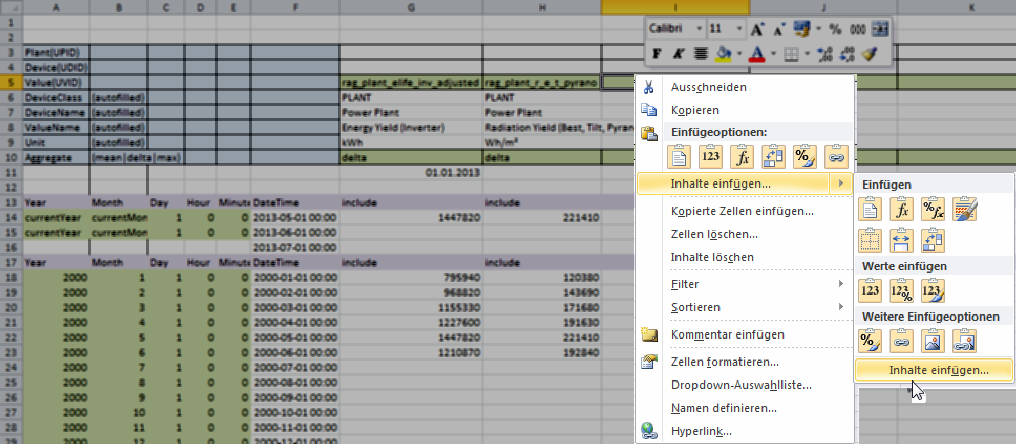
Now, open the sheet Data. Select the cell to the right of the last filled cell in the row Value(UVID). From the main Excel menu choose , or right-click with the mouse over this cell and choose Paste Special from the context menu.
Finding a UVID from PVGuard
Describes how to find a UVID for a data channel in the PVGuard GUI.
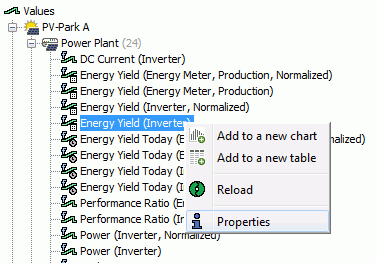
If you want to find the UVID for a data channel in the PVGuard program, first locate the desired data channel in the Plant Explorer (lower left-hand panel) of the program. Then right-click on the channel and select Properties in the context menu.
The Component Information dialog will appear, with the UVID shown as the first entry. Select this text, then right click the selection and choose Copy to save the UVID in the clipboard.
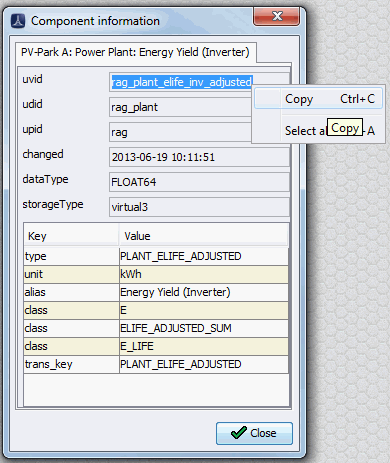
You can then paste the value into the cell in the Data sheet.
Data Aggregate Functions
Explains data aggregation and the data aggregate functions in PVGuard
Data aggregation
Assume data is being logged from a plant every 5 minutes. Over the course of a month this would come to around 8,500 data points. If you wanted to look at a chart for this data over a month, you usually wouldn't want to see the output to a 5-minute resolution – you would be more likely be interested, for example, in the daily output over that time. Plotting the data at a 5-minute resolution would provide much more detail than needed, with the added overhead of gathering and transmitting this data.
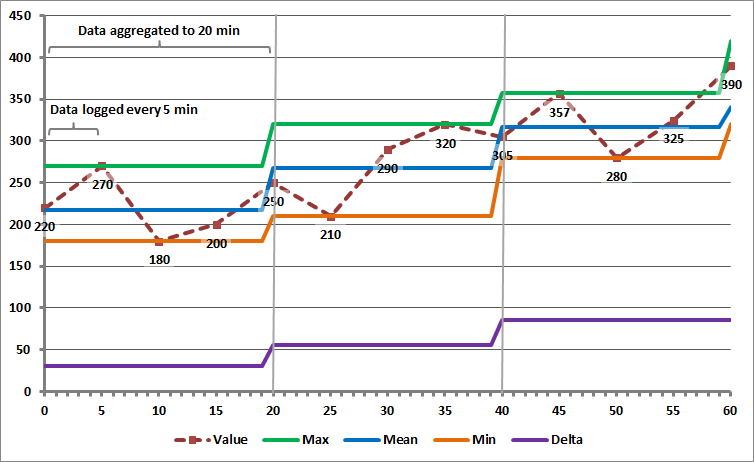
So a means is required for PVGuard to consolidate the data into sensible and usable chunks. This process is called data aggregation. The chart below illustrates the process. In the chart, data is being logged at 5-minute intervals, but you want it to be plotted to a 20-minute resolution. So on the graph, the value to be plotted for every 20-minute interval has to be calculated from the four raw data readings.
The question is how should the plotted data be aggregated from the low-resolution logged data? There is no single way of doing this; the answer depends on what you intend to use the data for. Therefore PVGuard provides a number of ways of doing it. These are known as the Data Aggregation functions.
Data aggregation functions
- The average of the data points over the resolution period
- The maximum or minimum values over that period
- The overall change (delta) in the value over the period
In the illustration, the original data is shown by a red dashed line, with points every 5 minutes. The mean, maximum and minimum are shown by the solid blue, green, and orange lines. These only change every 20 minutes – the period of the aggregation.
Often the differences between the mean, maximum or minimum figures will be insignificant. When you want to get an overall impression of a plant’s output over a day, it probably doesn't matter which you use. In most cases the default – often the mean – will suffice. However, there may be times when using one of the other aggregates can reveal useful information.
- Aggregate
- Description
- Mean (average)
- The mean is probably the most useful aggregate function, producing an average of the values over the period.
- Minimum
- The minimum aggregate could be useful in identifying short-term plant outages, where the output might drop to a low value or even zero for a short period during the aggregation interval. In this case the mean might only show a slight reduction, especially if many data points are involved. The minimum might also be useful in identifying short-term reverse string currents.
- Maximum
- The maximum aggregate could be useful in establishing the absolute maximum radiation or output for the plant over the day. In addition it may be useful in establishing whether any of the components – especially the inverters – are overloaded over the period.
- Delta
This aggregate shows the difference between the value at the start of one aggregate period and the start of the next. Being a difference, its absolute value will be much smaller than the original data value, and can even be negative. The delta graph identifies changes in, or the rate of change of the data value concerned.
Delta aggregates can be used to identify periods of rapid change in a plant's output, for example, when there is intermittent cloud cover or when there are transient problems in the equipment. For cumulative values such as total energy yield, the delta can identify fluctuations that would be difficult to spot on the steadily rising line.
- Aggregate
- Description
- Sum
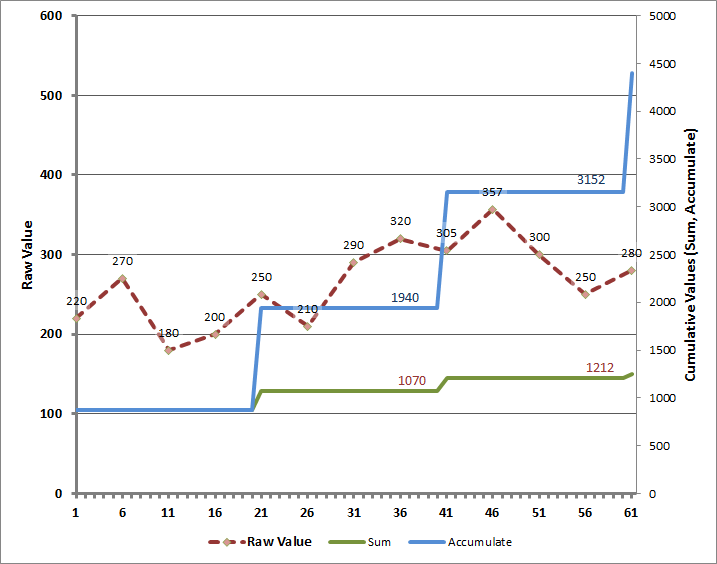
In the Sum aggregate the values of each of the raw data points are summed over each of individual aggregate period. For example, if the raw data values for two periods are [2, 5, 7] and [5, 6, 8] the Sum aggregate will show [14 and [19].
- Accumulate
The Accumulate aggregate is similar to the sum aggregate except that sums the values over the whole period of the display. It will therefore show a continually rising line. For example, if the raw data values for two periods are [2, 5, 7] and [5, 6, 8] the Accumulate aggregate will show [14] and [33].
The last aggreagte only applies to digital status data:
- List
The List aggregate only applies to digital (status) values in a tabuluar display. When chosen, all the individual status values that occurred over the period will be listed in the output.
Terms Used
Gives an overview to the terms used in FlexReportXL.
The following terms are used in this manual:
- UPID
- This is a unique identifier used by PVGuard to identify each power plant. No two plants can have the same UPID. In addition to their UPID, plants will also have an Original Device Name and a Customizable Device Name (otherwise known as Alias) to identify them. The former is the name which is initially used when the plan is being configured in PVGuard. The latter is the name commonly used to refer to them by the plant operator. This can be changed by the operator.
- UVID
- A unique identifier used by PVGuard to identify any single data channel. No two data channels across the whole PVGuard system can have the same UVID.
- Plant Explorer
- The hierarchical panel in PVGuard that you can use to browse through the devices in your plants and their data channels.
- Alias
- The name you assign in PVGuard to any of the devices in a plant. Can be adjusted in PVGuard.
The Data Sheet
Describes how to fill in the Data sheet in FlexReportXL.
The Data sheet initially looks similar to the example below.
- The upper rows
- The columns here define the data channels whose data is to be included in the report.
- The left-hand columns
- These rows set the time period(s) for which the data is required.
- The returned data area
- This area will be updated by PVGuard each time that the report is produced.
- Green cells
- These are for your input.
- Gray/White cells
- These will be filled in by FlexReportXL.
Data sheet: User information
Describes how to fill in the Data sheet in FlexReportXL.
- Receiver
- The e-mail address to which the completed report must be sent. For example
- Username
- Your valid username for PVGuard (this will define which plants are available for the report).
- Auth
- An authorization string provided by skytron. If this string is not present and correct, the Excel template will be rejected by FlexreportXL. It will be issued to you by skytron and will be a long string of characters, for example: crYptlyIyQsAaHqJ3kPhSrQWjhTgHi3237ufsHkxywu3wWbM=.
Upper Rows: Defining the Data Channels
Describes how to fill in the Data sheet in FlexReportXL.
You define which data channels you want included in the report in the upper rows that form the headings above the data area. You should only fill in the green cells in the top and bottom rows; the other cells such as name and units will be filled out automatically when you receive the report.
- Value(UVID)
- The Universal Value Identifier that identifies this data channel in PVGuard. E.g. rag_plant_inv_pr.
- Aggregate
- The Aggregate defines how the reported data is aggregated (calculated) from PVGuard's raw data. It should be usually set to delta for energy data (Wh, kWh), and mean for all other data types. However, for special purposes any other valid PVGuard aggregate is possible, for example: min, max, sum. For more information see section Data Aggregate Functions.
Left-Hand Columns: Configuring the Time Span
Describes how to set the time-frame for the data reported in FlexReportXL.
Below the upper rows that define the data channels, the table is organized into Timespan Blocks. These are blocks of rows that define a distinct time period for which data should be retrieved. You can have any number of these blocks as you wish. For example, you might have one block that defines the data by days in the current month, and then another with the accumulated data for the months in the current year.
Each of these time block has a heading row at the top - shown with a gray background in the illustration.
Under the heading come a series of rows that define the individual dates/times for the data. There are five green cells at the right in which you can enter the date/time definition for that row. To the right of these comes a single column which is filled in automatically, and shows the actual timestamp for the retrieved data. After this comes the data itself, filled in by PVGuard.
- Year
- An absolute value (e.g. 2010), or a relative date such as currentYear or currentYear-1
- Month
- An absolute (1-12) or a relative value such as currentMonth or currentMonth-1
- Day
- An absolute (1-31) or a relative value such as currentDay or currentDay-1
- Hour
- An absolute value, 0 to 23
- Minute
- An absolute value, 0-59
As indicated in the exmples above, relative time or date values may also be defined by giving an offset relative to one of the special terms currentYear, currentMonth, currentDay. For example, currentDay-1 or currentYear+1.
There may be any number of rows in each Time-Span Block. However the time or date interval between consecutive rows must be the same throughout the block. Note here that the difference between the first two rows of the block defines the time or date interval for the whole block. The remaining rows must also be defined with the same interval.