Do you need support?
Contact us

Regardless whether it is a first consultation or a concrete service request, with our contact form we put you in contact with the right person.
Introduction
Explains the need for data rectification in PVGuard
When developing software monitoring systems, often a major source of complexity comes from having to deal with errors that occur outside the system. PVGuard, is typical here; it receives its data from a multitude of devices spread across a large number of sites. Many of these are located in disparate environments with demanding environmental conditions.
- Malfunctions, either short- or long-term
- The sudden replacement of defective equipment (either planned or unplanned)
- Broken communication links, either for accidental or intentional reasons
- Maintenance activities must be undertaken
So instead of an ideal data stream with regular and reliable data transmission, data outages occur or the data that is received is clearly implausible. Examples of this include, figures for an inverter's output that appear to far exceed its rated figure or, when equipment is replaced, the figures for the cumulative energy production from that device apparently reset to zero.
PVGuard has to deal with all these sorts of error, so as to present the owners and operators with accurate and usable energy data for their plant that they can rely on. The mechanisms employed have been developed by skytron energy over many years of monitoring the actual operation of real systems over time. Its preconfigured plant views show energy figures based this cleaned data.
This document describes the mechanisms employed to check the incoming data, and to rectify the incoming data intelligently, without introducing errors.
Adjusted energy data channels in PVGuard
Describes the mechanisms used to rectify the energy data in PVGuard
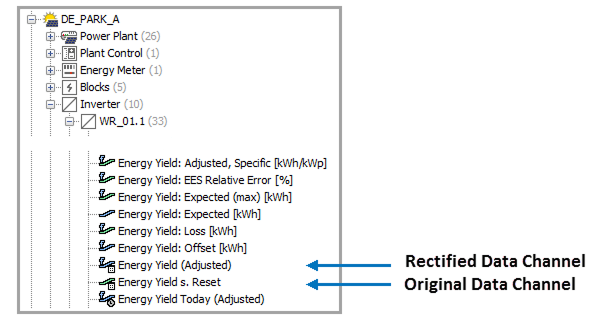
The data rectification process fills the gaps in the original data using interpolation. As part of this, an additional, corrected data channel is added and automatically filled, based on data from the original data channel. The original data channel is always preserved, unchanged, so that it is possible to distinguish between and compare the calculated and the actual measured values at any time.
Data channels containing rectified data can be identified in PVGuard's Plant Explorer (located on the lower left-hand side of the program display) using the symbol f in the icon. An example is shown for a typical inverter in Figure 1. The channels produced as a result of data rectification are usually labelled with the term Adjusted.
Energy data rectification
Describes the main functions of the data rectification mechanism in PVGuard.
Identification and removal of implausible discontinuities in the readings
Describes how sudden discontinuities in the received data are treated
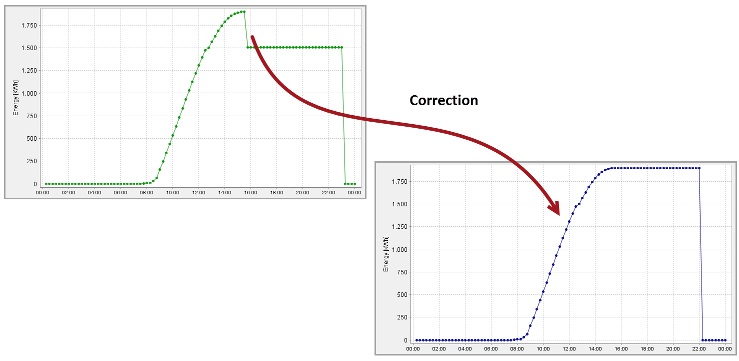
Example: The original readings suddenly exhibit a significant "jump" lower. Such behavior might occur after an inverter has been replaced. The energy readings of the new inverter do not correspond to the last reported values of the old inverter.
The energy data correction process detects this sudden decrease in reading and, recognising it as needing rectification, adds the detected difference to it and to all subsequent data values. In the case of a positive jump in the reading, its plausibility is checked against a predetermined maximum possible power value (e.g. installed peak power, rated power or maximum expected radiation power).
Filling gaps in the data (weighted interpolation)
Describes how gaps in the data (i.e. missing data points) are treated
Example: A break in the data link interferes with the continuous record of the measurements.
The data cleaning process attempts to fill in the gaps in the data in such a way that the data can still be used for analysis.
- Smart interpolation using a reference data channel
- Smart interpolation using the solar elevation
- Linear interpolation for short gaps

Smart interpolation using a reference data channel
Describes how data is interpolated when a reference channel is available
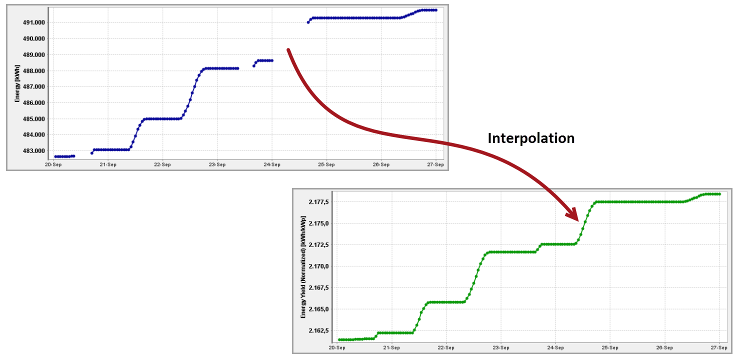
In this method a reference data channel (usually that of a radiation sensor) is shifted and enlarged/compressed in such a way that its starting and ending values correspond to the original data readings. This method always produces the best result and is used when a reference data channel is continuously available.
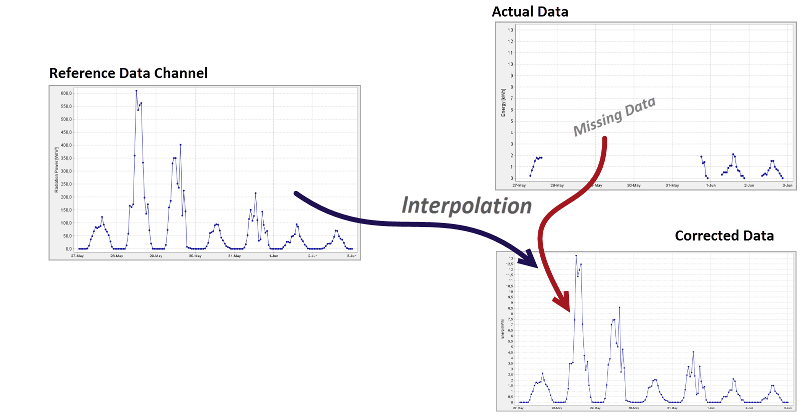
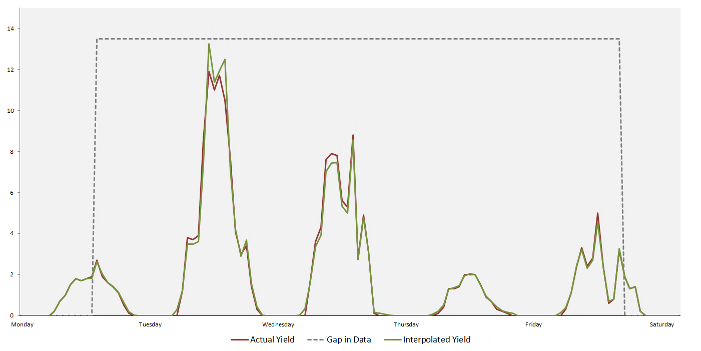
The image below shows the result of simulating a data outage. By this means, the result of the interpolation process has been compared to the actual energy production.
Smart interpolation using the solar elevation
Describes how data is interpolated using the solar elevation
If no reference data channel is available, the solar elevation is used for the interpolation. The energy production is assumed to increase proportionally to the height of the sun above a defined threshold elevation.
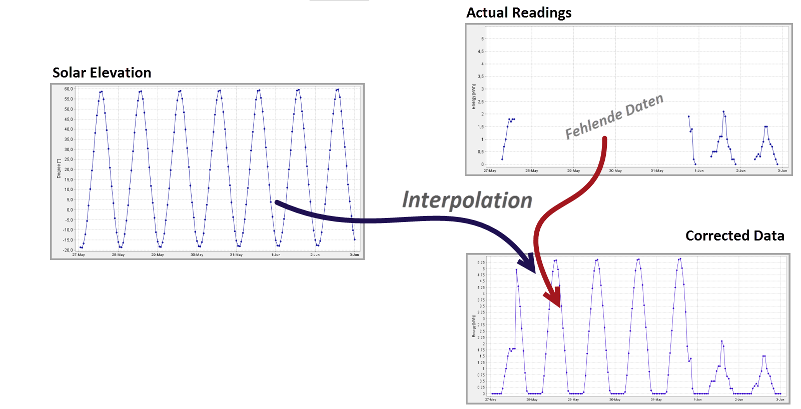
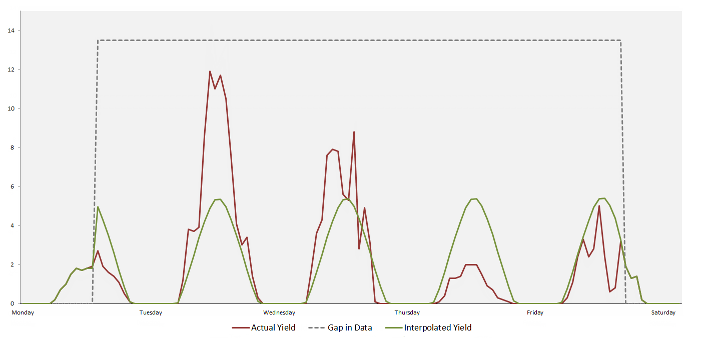
The image below shows the result of simulating a data outage. By this means, the result of the interpolation process has been compared to the actual energy production.
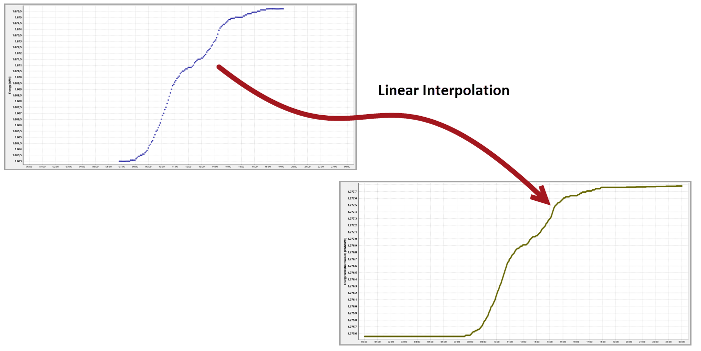
Linear interpolation for short gaps
Describes how linear interpolation is used to fill short gaps in the data
Linear interpolation is used for very short gaps, as well as to interpolate between two identical or only slightly different readings.
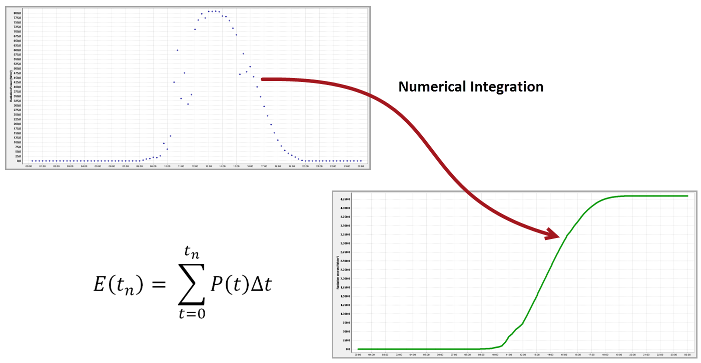
Numerical integration to derive energy data from power
Describes how energy data is derived from power readings by a numerical integration process
The last form of energy channel cleaning is used in the case of devices that instead of an energy data channel, only provide power output readings. This is the case with some models of inverter. The energy data channel must be calculated by summing the power data. Should there be a gap in the data, the last available reading is assumed to apply for a user-definable time period. The power readings are then subjected to a plausibility check. This process is shown in Figure 1.