
Update: PVGuard® 2.5Heat Map

Apart from fixes, version 2.5 of PVGuard also brings a number of improvements to the application: Heat Map Chart, Data-Dependent Color-Coded Widgets and Picture-Coded Widgets.
(1) Heat Map Chart
With the new heat map chart functionality, completely new data views are possible. For example, you can compare the temperature behavior of different inverters during operation and detect abnormalities and malfunctions at an early stage, so that you can make earlier repairs and avoid unexpected downtimes.

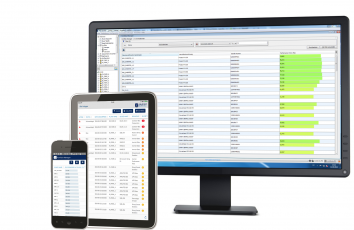
(2) Data-Dependent Color-Coded Widgets
Color-coded widgets complement the ability to create customized dashboards. For example, with these widgets, you can display all string inverters in a plant at a glance and see performance drops almost in real time. This makes it easier to monitor large solar plants and is especially useful for non-professional users.

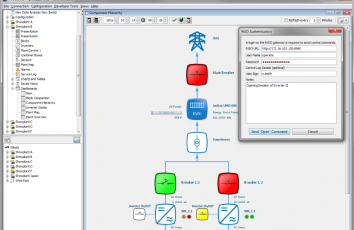
(3) Data-Dependent Picture-Coded Widgets
Extra features have been added to the widget libraries in the Dashboard Designer, so that your dashboards can be even more customized to your O&M requirements. For example, images of the main plant components, such as the main switches of the power plant, can now be selected and assigned to individual switching states.

Please feel free to contact our service department at if you have any questions about the new version of PVGuard®.
Yours faithfully,
The skytron® energy Team
News
Archive
Update: PVGuard® 2.6
Fleet Manager with aggregated values
Apart from fixes, version 2.6 of PVGuard also brings a number of improvements to the application: Fleet Manager with aggregated values, Expected Power / Expected Yield, alarm functions now include seasonality.
PVGuard® 2.4
Fleet Management
Intelligent monitoring across plant portfolio through new Fleet Manager
Update: PVGuard® 2.3
integrated control functionality
PVGuard® version 2.3 brings a number of improvements to the application: Remote control of PV systems from the control room, system controller and network analysis in high resolution, further integration of FlexReportXL as well as additional enhancements.